

How AI chart analysis reads trading charts without trusting a guess
AI chart analysis works best when you give the model a clearly identified chart, ask it to separate visible facts from interpretation, request a competing explanation, and verify every material claim in your charting platform. The model can organize evidence and expose questions; it cannot turn an incomplete screenshot into reliable market data.
That distinction matters because AI chart analysis should be a compass, not a crystal ball. Before trusting a summary, verify the instrument, timeframe, market data, chart context, data source, and indicators. Then check the response against NinjaTrader 8 or your other charting platform.
This guide gives you a repeatable workflow for reading trading charts with AI, avoiding false precision, and using ChartGPT inside NinjaTrader 8 without allowing a small context error to shape a major trading decision.
AI chart analysis is best understood as a structured review of supplied chart information. Depending on the input, an AI system may help you:
- Describe visible price action
- Summarize trend structure
- Identify potential support and resistance areas
- Compare bullish and bearish interpretations
- Organize indicator readings
- Highlight missing information
- Generate questions for further analysis
- Explain technical-analysis concepts in plain language
These functions can support discretionary decision-making, but they do not remove the need for verification. An AI response is only as reliable as the chart context and market data behind it. If the system receives an incomplete screenshot, the wrong timeframe, an unclear instrument, or stale data, it may produce a polished explanation based on incorrect assumptions.
AI should therefore support your process rather than replace it. It can help you inspect evidence, but you remain responsible for identifying the instrument, checking live conditions, evaluating risk, and deciding whether any trade is appropriate.
AI chart analysis should not be treated as:
- A guaranteed forecast
- An autonomous trading strategy
- A substitute for market-data verification
- A replacement for NinjaTrader 8
- A source of personalized financial advice
- An execution tool; ChartGPT does not place or manage trades
Avoid language that implies certainty. Terms such as “will rise,” “must reverse,” or “guaranteed breakout” describe outcomes that cannot be established from a chart review alone. A more defensible analysis distinguishes between what is visible, what is inferred, and what remains unknown.
The four parts of a trustworthy workflow
A reliable review should distinguish facts from conclusions.
Observable facts
These are statements that can be checked directly on the supplied chart or data:
- The latest visible candles have higher highs and higher lows.
- Price is below a displayed moving average.
- The chart contains a marked horizontal level.
- Volume is shown in a separate panel.
- The most recent bar is still forming, if the platform indicates this clearly.
- The visible chart covers a specified period.
Interpretations
These are explanations based on the observations:
- The market may be in an upward structure.
- The horizontal level may be acting as support.
- Momentum may be weakening.
- The price may be consolidating near a prior area of interest.
Interpretations are not automatically wrong, but they require more judgment than direct observations. Ask the AI to label them separately. This makes it easier to challenge an interpretation without disputing the underlying evidence.
A useful response structure is:
- What is visible
- What that may indicate
- Alternative interpretation
- What would confirm or weaken each interpretation
- What information is missing
For example, instead of asking, “Is this a bullish reversal?” ask:
Describe the recent price structure. Then provide one interpretation consistent with a bullish reversal and one interpretation consistent with continued range trading. Identify the evidence for each view and the information that would distinguish them.
This approach encourages competing interpretations rather than a single confident narrative.
Choose AI chart analysis inputs: structured data, curated context, or a screenshot
AI chart analysis commonly begins with either a screenshot or structured chart data. Each format has advantages and limitations.
| Input type | Useful for | Main limitation | Verification priority |
|---|---|---|---|
| Screenshot | Visual structure, candles, chart layout, visible levels, indicator placement | May omit labels, settings, prices, session details, or exact values | Confirm symbol, timeframe, scale, and indicator settings |
| Structured chart data | Exact OHLC values, timestamps, indicator values, and repeatable inputs | May omit visual context, annotations, and chart layout | Confirm timestamps, units, session, and calculation method |
| Screenshot plus written context | Combining visual review with key metadata | Still depends on the accuracy of the supplied context | Match the written details to the platform |
| Chart description in text | Reviewing a specific setup or hypothesis | Can lose important visual relationships | Check the description against the original chart |
A screenshot is not a complete market-data record. It may show candles and indicators, but it may not reveal whether the latest bar is closed, how the indicator was configured, or whether the visible price scale is adjusted. It can also be difficult to distinguish between similar symbols or contract representations if the identifying information is missing.
Structured chart data can improve precision when the exact values and timestamps are available. However, numerical data alone may not capture every visual feature of the chart. Session boundaries, annotations, chart scaling, and display choices can affect how a discretionary trader interprets the setup.
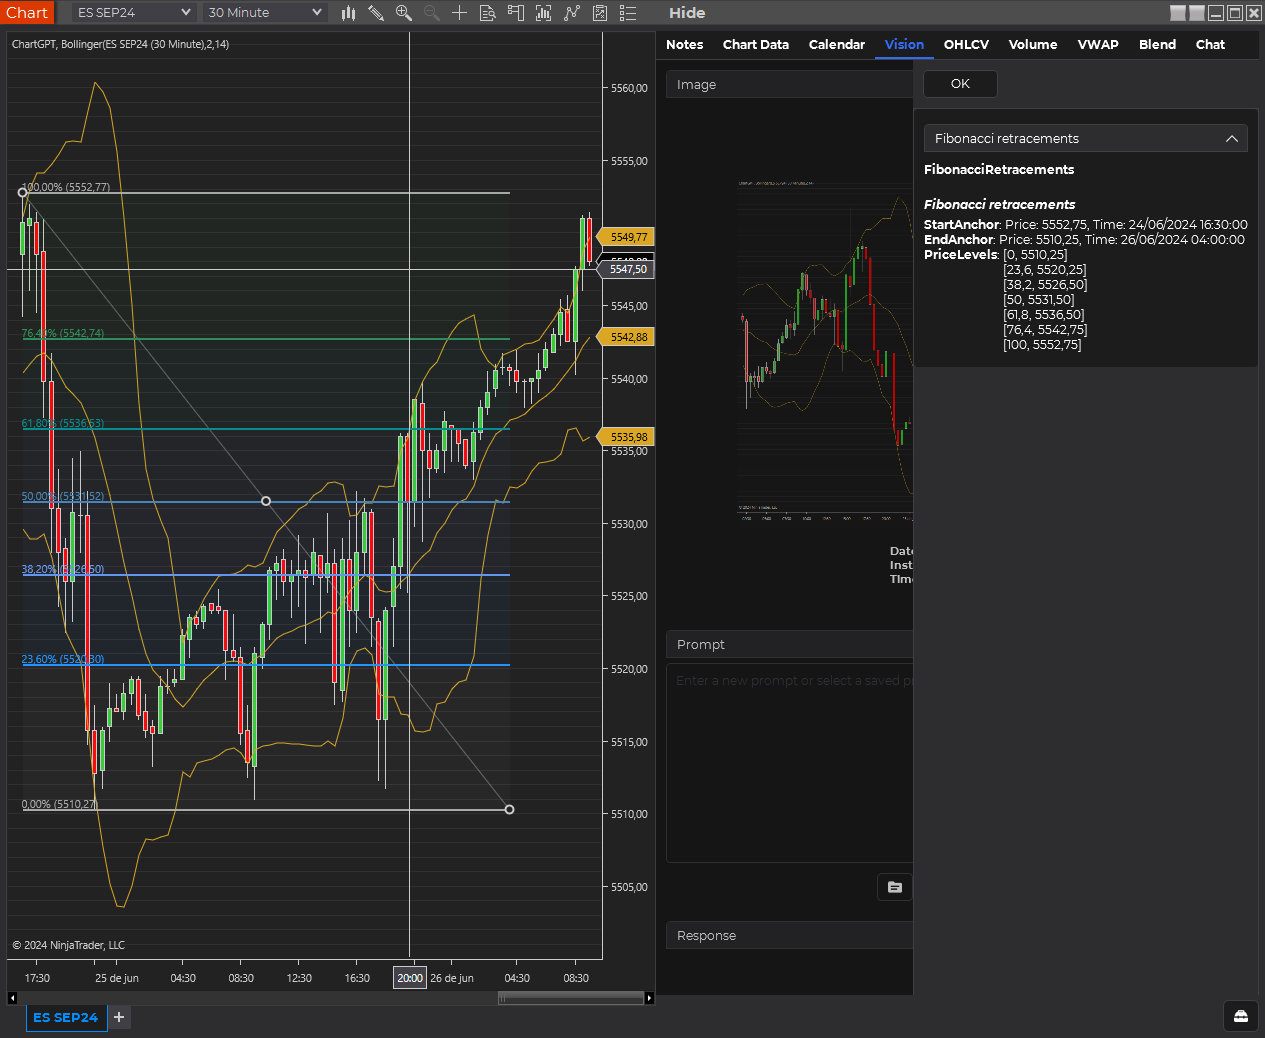
The Vision tab supplies visible chart context, but image-based conclusions still need a direct platform check.
The strongest workflow is to combine the two when practical: provide the screenshot for visual context and provide written metadata or structured values for verification. If you use only a screenshot, ask the AI to state what it can and cannot read rather than filling gaps with assumptions.
Define the timeframe, range, indicators, and research question
Chart context is the foundation of any useful review. Before asking an AI system to interpret a chart, establish exactly what it is looking at.
At minimum, confirm:
- Instrument — the ticker, contract, market, or symbol
- Timeframe — such as a one-minute, five-minute, hourly, or daily chart
- Session — the relevant trading hours or session template, where applicable
- Data source — the platform, feed, or source used to construct the chart
- Chart type — such as standard candlesticks, bars, or another format
- Visible time range — enough history to assess the current structure
- Indicators — names, settings, and whether they are calculated from the displayed data
- Current-price location — whether the latest bar is complete or still forming
A screenshot may communicate some of this information, but not always clearly. Small labels can be difficult to read, and cropped images may omit the symbol, timeframe, price scale, or indicator settings. If those details are not visible, provide them as text rather than asking the AI to guess.
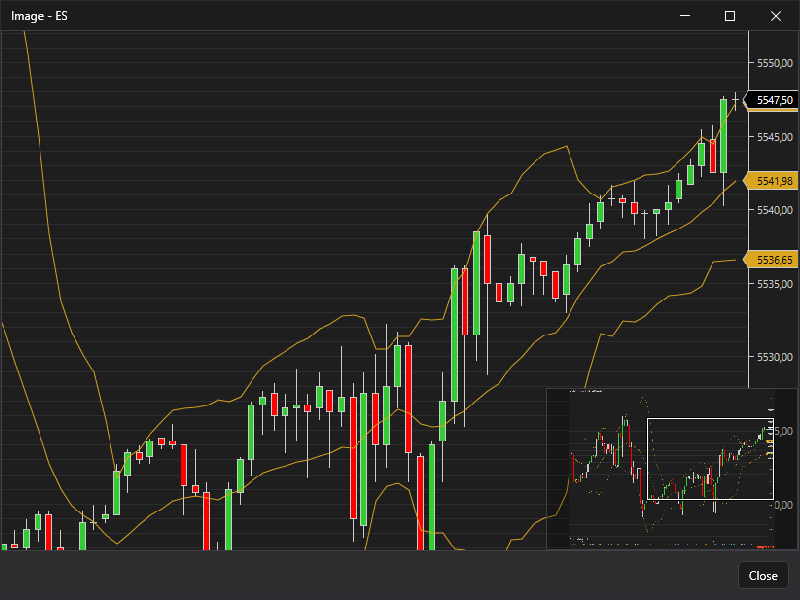
Expanding the captured chart helps you inspect what is actually visible before asking the model to interpret it.
This matters because the same visual pattern can have different meanings across instruments and timeframes. A movement that appears significant on a short-term chart may be ordinary noise on a higher timeframe. Likewise, a level visible on one market may not be relevant to another.
A good starting prompt might be:
Analyze the attached chart descriptively. The instrument is [instrument], the timeframe is [timeframe], and the data source is [source]. Identify observable trend structure, recent price behavior, visible levels, and indicator readings. Separate observations from interpretations. Do not make a forecast or trade recommendation. List any missing context that limits the analysis.
This format gives the system a defined task and makes uncertainty easier to identify. Timeframe is one of the most important variables in chart interpretation. Technical analysis performed on a single timeframe can provide only a partial view of market structure.
A short-term chart may show:
- Rapid price movement
- Local support and resistance
- Intraday consolidation
- Short-lived momentum changes
- Noise that is less visible on higher timeframes
A higher-timeframe chart may show:
- Broader trend structure
- Larger price ranges
- Major levels
- Extended consolidation
- Context that changes the meaning of short-term movement
These views can disagree without either being incorrect. A market can be rising on a five-minute chart while remaining within a broader daily downtrend. Ask the AI to state which timeframe supports each observation and avoid combining conclusions from different charts without labeling them.
When reviewing multiple timeframes, use a consistent sequence:
- Identify the higher-timeframe structure.
- Mark the visible areas that may matter to the current price.
- Review the intermediate timeframe for developing structure.
- Use the lower timeframe to describe current behavior.
- Note where the timeframes agree and where they conflict.
Do not ask an AI system to reconcile multiple charts if the instruments, sessions, or timestamps are unclear. Confirm that the charts refer to the same market and that the data windows are comparable. Indicators can help organize information, but they do not independently establish what price will do next. Their interpretation depends on the underlying data, settings, timeframe, and market conditions.
When including an indicator in an AI review, provide:
- The indicator name
- The relevant settings
- The timeframe
- The displayed value, if available
- Whether the current bar is complete
- The price data used to calculate it, if known
Ask the AI to describe the indicator rather than treating it as a decision rule. For example:
Describe the relationship between price and the displayed moving average. Explain what this relationship may suggest and provide at least one alternative interpretation. Do not convert the indicator into a buy or sell signal.
This reduces the risk of turning a single reading into a deterministic conclusion.
Be particularly careful when the chart includes several indicators that measure related features. Multiple indicators may appear to agree because they are derived from similar price information. Their apparent agreement is not necessarily independent confirmation.
Ask for evidence, counter-evidence, and uncertainty
Uncertainty should be part of the output, not an afterthought. A useful AI review should identify the limits of the available evidence.
Ask questions such as:
- Which observations are directly visible?
- Which conclusions depend on assumptions?
- What information is missing?
- What alternative explanation fits the same chart?
- Which claims cannot be verified from the screenshot?
- How could a different timeframe change the interpretation?
- Is the latest candle complete?
- Could the displayed pattern be affected by limited history or session boundaries?
You can also request an uncertainty statement:
End the analysis with a list of assumptions, unreadable or missing information, and claims that require verification in NinjaTrader 8.
This is especially important when using screenshots. If the system cannot read an exact value or label, the appropriate response is to acknowledge the limitation—not to estimate the value and present it as fact.
Avoid false precision. A chart image may support a general description of a visible range, but it may not support an exact level to several decimal places. If the exact value matters, verify it directly in the platform or provide structured data. Evidence-led prompt patterns
Use prompts that constrain the task and make verification easier.
Descriptive review
Describe only what is observable on this chart. Identify the instrument, timeframe, visible price structure, marked levels, and displayed indicators if they can be read. Separate direct observations from interpretations and list missing context.
Competing interpretations
Provide two plausible interpretations of the displayed price action. For each, list supporting observations, conflicting observations, and what future evidence would make the interpretation less plausible. Do not provide a trade signal.
Multi-timeframe review
Compare these charts only after confirming that they show the same instrument and compatible data windows. Explain where the timeframes agree, where they conflict, and which conclusions cannot be established from the supplied information.
Verification-focused summary
Summarize the analysis as a checklist of claims to verify in NinjaTrader 8. For each claim, identify the chart element that supports it and any assumption required.
Verify values, freshness, chart structure, and unsupported claims
Checking data accuracy
Verify every material value against the chart data in NinjaTrader 8. Check the data timestamp, source, instrument, session, timeframe, and whether the latest bar is still forming. If any item is unclear, mark the analysis as unverified. Stale or mismatched market data can make an otherwise polished technical analysis misleading.
Assessing chart structure
Compare the trading chart with the AI chart analyzer’s interpretation. Check the claimed pattern, support and resistance areas, candlestick structure, and visible range directly on the platform. A screenshot can hide scale, session, or resolution problems, so treat visual pattern recognition as an interpretation until the chart confirms it.
Recognizing unsupported claims
Reject claims that do not point to visible chart evidence or supplied market data. An AI chart analysis tool should not promise prediction accuracy, profitable outcomes, or specific trading signals such as entries, exits, or stop-loss levels. Mark any unsupported conclusion as speculation and keep it out of the verified findings.
Common failure modes: missing context, false precision, and automation confusion
Wrong instrument
A screenshot or prompt may omit a clear symbol. The AI may then discuss the chart as if the market were known. Always verify the instrument independently.
Wrong timeframe
A chart can be interpreted on the wrong interval if the label is cropped or unreadable. State the timeframe in the prompt and confirm it in NinjaTrader 8.
Incomplete screenshot
A cropped image may hide the price scale, indicator settings, session information, or the latest candles. Ask the AI to identify missing context.
Confusing correlation with confirmation
Several indicators may point in a similar direction because they use related inputs. Treat them as evidence to examine, not automatic confirmation.
Reading a live bar as completed
An unfinished candle can create a temporary pattern. Clearly distinguish live-bar observations from completed-bar observations.
Treating a level as exact
A visually marked area may be approximate. Verify exact prices in the platform before using them in a plan.
Accepting one interpretation
A confident explanation can make an uncertain chart appear settled. Request at least one plausible alternative and the evidence that would distinguish it.
Turning analysis into execution
A descriptive chart review is not an order instruction. Keep the AI task separate from order entry, position sizing, and risk controls unless those functions have been independently verified in the relevant system.
A bounded NinjaTrader walkthrough
The question and frozen context
Use the following process before relying on an AI-generated chart summary.
Confirm the instrument
Check the symbol, contract, or market in NinjaTrader 8. Make sure the chart reviewed by the AI corresponds to the chart you are currently examining. If a futures contract or other instrument is involved, confirm the specific contract representation and relevant session context.
Confirm the timeframe
Verify the chart interval and whether the AI received the same timeframe. A mismatch can change the apparent trend, levels, and indicator readings.
Confirm the data window
Check the period visible on the chart. Determine whether the review includes enough history for the stated observation. A narrow screenshot may make a broader pattern appear more significant than it is.
Check whether the current bar is complete
The latest candle can change while it is forming. Establish whether the AI analyzed a completed bar or a live bar. If this is unclear, treat conclusions based on the latest candle as provisional.
The response fact-check ledger
Compare visible claims with the chart
Review each factual statement individually. Check the candles, price scale, marked levels, indicator panels, and timestamps. Do not accept a complete paragraph as one indivisible conclusion.
Test competing interpretations
Ask what evidence would support or weaken the primary interpretation. A useful review should not depend on a single narrative.
Record what remains unknown
If the AI cannot establish the data source, session, exact value, or bar status, record that limitation. Unverified context should remain unverified.
Input-selection and verification checklist
Before using an AI-generated chart summary in your discretionary process, confirm:
- The instrument is correctly identified.
- The contract or symbol representation is correct.
- The timeframe matches the chart in NinjaTrader 8.
- The session or trading-hours context is understood.
- The data source is known or clearly marked as unknown.
- The visible date and price range are sufficient for the analysis.
- The latest bar is identified as complete or still forming.
- Indicator names and settings have been checked.
- Exact prices and levels have been verified on the platform.
- Direct observations are separated from interpretations.
- At least one competing interpretation has been considered.
- Missing information and assumptions are documented.
- No forecast is being treated as a certainty.
- The analysis is not being used as an unverified execution instruction.
For additional technical guidance, review the ChartGPT documentation and the next guide on using ChartGPT with NinjaTrader 8. These resources should complement, not replace, your own platform-based verification.
Where ChartGPT fits inside NinjaTrader 8
Inside NinjaTrader 8, ChartGPT can prepare selected context for a provider and model you configure. The Chart Data tab exposes chart values and supported indicator data in a structured form. The Vision tab uses the visible chart, including visible drawing context, and therefore requires a vision-capable model. Provider availability and model capabilities can change, so verify the selected model before sending an image or other specialized input.
AI chart analysis is most useful when it makes your reasoning more explicit. It can organize chart context, identify questions, compare interpretations, and turn a vague visual impression into a reviewable set of claims.
Its limitations are equally important. AI may lack complete market data, misunderstand a screenshot, miss a setting, or express an uncertain interpretation with excessive confidence. Verification protects against those failures.
A disciplined workflow is simple:
- Provide accurate context.
- Ask for observable evidence.
- Separate facts from interpretations.
- Request competing explanations.
- State uncertainty and missing information.
- Check every material claim in NinjaTrader 8.
- Keep analysis separate from execution.
If you want to evaluate the workflow in your own charting process, begin with the verification checklist above and review the technical documentation before using the trial. The goal is not to make AI sound certain. The goal is to make your market review clearer, more transparent, and easier to verify.