
Use this chart screenshot checklist to prepare a NinjaTrader image for AI analysis. Keep the instrument, timeframe, price axis and enough earlier candles in view. Then check the capture in ChartGPT Vision and compare the response with source values.
Use AI vision as an educational tool to review a chart you already understand. This guide follows documentation checked on 8 October 2026; its prompt and report are examples, not model tests.
Define the trade question before AI chart analysis
Give your technical analysis one task, such as comparing marked price levels or describing a pullback. Name the instrument, chart type, timeframe, session, time zone and date range. State whether the latest candle has closed. A daily chart and an intraday view can show different parts of one move.
If you think a breakout is forming, ask what visible evidence supports that reading and what would invalidate it. Mark any proposed invalidation level yourself and explain the rule; see our NinjaTrader AI research workflow for the wider process.
Keep chart structure, candle detail and labels readable
Include the swing or range under review and enough earlier bars to show market structure. A close crop can hide the move that led to a pattern. A full chart squeezed into a small image can make text too small to read.
- Keep the price axis, time scale and needed indicator settings visible.
- Label support and resistance or a trendline without covering the candles.
- Include only the drawings needed for this question, rather than every level.
Define how you marked order blocks or fair value gaps; the model may read those terms differently.
Review the chart screenshot in ChartGPT Vision
Open ChartGPT’s Vision tab and check the captured image. Vision captures the visible chart area, including zoom effects. Apply the chart screenshot checklist to the preview itself.
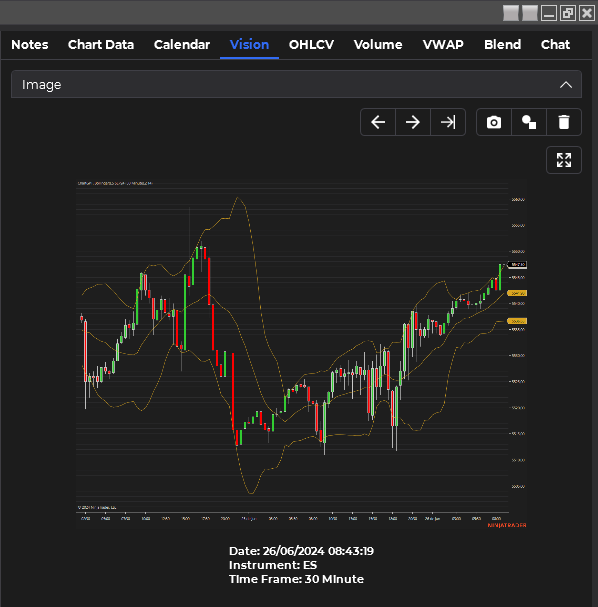
Documentation image: the Vision interface with an ES chart and a 30-minute label.
Use maximize for a larger view, check small text with the zoom controls, then close that window. Enlarging an image cannot recover missing numbers or blurred pixels.
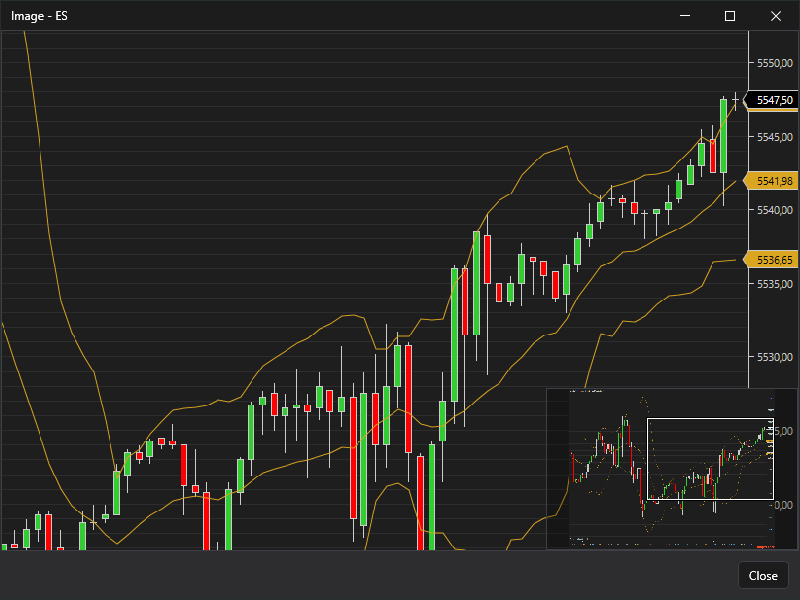
The expanded view helps you check details before analysis.
Check that needed drawings survived capture; if one is missing, adjust the source view and check the next image. Navigation moves between images and analyses; deleting an image also removes its response.
Check privacy before sending screenshots
Hide account balance, account IDs, broker details, API keys and private notes that the question does not need. This is a manual check: fix the source and check the next capture.
Sending the image to your chosen provider is an upload. Keep the date and scale visible while removing private details.
Choose a vision model: Claude, Gemini or OpenAI
AI models need image support to read a capture. Select a provider you have set up and a vision-capable model using the provider guidance. The docs list OpenAI, OpenRouter, Anthropic Claude and Google Gemini for vision tasks. Model access varies by account and provider.
ChartGPT and ChatGPT use different workflows
ChartGPT is purpose-built for use inside NinjaTrader; ChatGPT is a separate OpenAI service. Follow the Vision capture path here, not instructions from a general chatbot.
In the Prompt Area, give the instrument, timeframe and any missing session context. Mark supplied background as your input, not a fact found in the image. A capture is a snapshot, not a live market data feed. Check the live price or recent news at its source; verify order details in your broker platform before execution.
Ask for a structured read, not a trade plan
After the chart screenshot checklist, ask for a short headline, observations, supporting labels and gaps. Adapt this sample prompt:
Review this NinjaTrader chart using the instrument, timeframe, session and bar status I provide. For each observation, name a visible candle, label or region. Separate facts from possible meanings and list anything you cannot read. Describe evidence against my view, without suggesting entries, exits or position sizes.
What AI reads from the chart
Chart patterns cannot prove a win rate; an obvious pattern says nothing about later liquidity. A bullish or bearish view is not a complete trade plan; AI output does not constitute financial advice.
Verify the AI chart read and its verdict
Put the answer and source side by side to check quoted prices, dates and named regions. Use Chart Data for exact prices when it holds the numbers you need, following our indicator-data guide. Verify arithmetic against source values too.
Judge evidence, not polish. This sample report shows how to keep usable findings in your research notes; it is not a trading result.
| Claim | Evidence to check | Review note |
|---|---|---|
| A bar closed above the line | Bar status and marked line | Reject the closing claim while the bar is forming |
| The image shows a pullback | Earlier swing and named bars | Keep as a directional interpretation, with its evidence |
| Price will continue higher | Future values are not in the image | Leave out the forecast |
Check a second answer against the same source; repeated agreement is not a test.
Finish the chart screenshot checklist
Whether you are a beginner or an experienced trader, use the same repeatable review:
- Confirm the instrument, period and bar status.
- Check that labels, drawings and private details are handled.
- Keep one question tied to what the image shows.
- Record the image, prompt, capture time, model and checked findings in your trade journal.
Keep this chart screenshot checklist with your research notes. To use the steps in NinjaTrader, explore ChartGPT or view the trial. Start with one clear image, then check each claim before using it.