

Prepare NinjaTrader indicator data for AI analysis by choosing one question and checking the numbers it needs. This guide helps a NinjaTrader user follow the documented steps; it does not report a product test.
For the process in context, see our NinjaTrader AI workflow.
Choose NinjaTrader indicator data for your trading question
Record the instrument, interval, date range, timezone and units; include the contract for futures trading. Keep these details in your notes when the export lacks them.
Decide whether you need closed bars or a bar still forming. Comparing closes may need just timestamps and prices; studying a moving average also needs its indicator values and settings.
An indicator on the chart does not prove its numbers are in the grid. Focus on comparing rows, checking sums or finding gaps; more input does not prove accuracy.
Export historical market data or use a chart tool?
NinjaTrader’s Historical Data export writes stored market history to a .txt file. In the Historical Data window, select the instrument, interval, type and dates, then click Export. This format uses UTC and end-of-bar timestamps.
This does not mean the file includes every chart indicator. For NinjaTrader indicator data, choose a source that supplies the fields you need.
| Task | Starting point | Check first |
|---|---|---|
| Export historical data | NinjaTrader’s export | History, interval and type offered |
| Check indicator readings | ChartGPT’s Chart Data tab | Which plots expose numbers |
| Review several timeframes | ChartGPT’s OHLCV tab | Whether its fixed coverage fits |
The OHLCV tab provides daily, weekly and monthly price and volume readings rather than custom indicator values. The indicator ChartToCSV is another export tool, with its own limits. ChartGPT is not needed for every export, and exporting alone does not amount to backtesting a strategy.
Check columns in the NinjaTrader 8 desktop platform
Select ChartGPT’s Chart Data tab to see indicators that expose numbers, normally through plots. Not every setting or internal calculation becomes a column.
Right-click a header to select fields, such as volume, then drag headers to change their order. The docs say these choices carry over between sessions.
Use filters and page controls to check the period covered by your NinjaTrader indicator data.
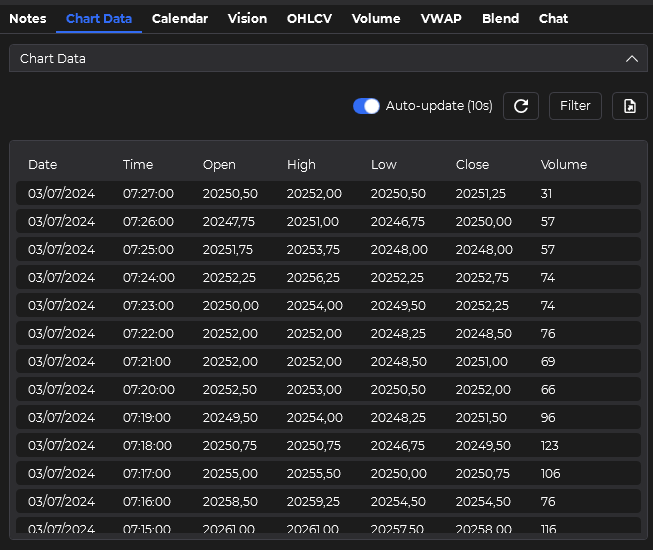
Documentation screenshot of the NinjaTrader indicator data view, showing historical rows rather than a product or model test.
Column visibility, filters and page controls do not prove what the software excludes from an AI request. Confirm what is sent before relying on a display setting to protect private details.
Check fresh readings and historical data gaps
The refresh button updates the view; Auto-Update refreshes the grid every ten seconds. Neither proves that the source is up to date or complete.
For a bar still forming, select that indicator’s properties and find Setup → Calculate. The documented choices are On Price Change or On Each Tick. These can increase the computer’s work; closed-bar research may not need the change.
Follow the Data Management guide to download missing history when your provider offers it. Refresh cannot supply history your data provider lacks. Note whether the latest row was complete when you checked your NinjaTrader indicator data.
Save a CSV file and import it into Excel
Use Export CSV, then open the file in Excel to load its rows into a worksheet. A text editor is another option for review; neither step implies a CSV import into ChartGPT.
Check the CSV format, timestamps, names, units, blanks and row order, especially after changing filters or pages. Record any missing context separately, and do not assume display changes define the export contents.
Built-in export timestamp rules do not necessarily apply to this CSV. The docs describe tick-size rounding in the grid, not guaranteed precision in the source or export.
Save your notes with the NinjaTrader indicator data file; the CSV does not prove what an AI request contains.
Choose a model and check provider pricing
In the Prompt Area, select a provider and model that supports your task, then use the tab’s analyze control. Your prompt and attached context must fit the model’s input capacity; there is no single safe row count.
The software license and provider bill are distinct costs, and ChartGPT does not cap provider spending. Check account usage and any spending limits. Remove keys and private details from shared material.
This untested example prompt uses the invented table below:
Use only these closed DEMO bars with UTC times. Each bar spans five minutes. Calculate the changes between closes, cite the rows and list missing context. Separate facts from interpretation without suggesting trades or guessing missing indicator readings.
Replace the example context with your own; prompt wording does not control which details the software sends. It cannot guarantee accuracy either.
Check AI answers before using them in a futures strategy
Check each value against your NinjaTrader indicator data, including its rows, units and time range.
This section uses DEMO, an invented teaching example with no assigned currency, not a live market or model test.
| Time (UTC) | Close | Change from prior listed close |
|---|---|---|
| 09:00 | 100.50 | Not available |
| 09:05 | 100.75 | +0.25 |
| 09:10 | 101.00 | +0.25 |
Manual checks give 100.75 − 100.50 = 0.25 and 101.00 − 100.75 = 0.25. These are price units, not cents, ticks or profit; three closes justify no trade or hidden-indicator claim.
Fix timezone errors or mixed bar states, and reject claims you cannot trace to the source. Repeated requests need the same checks; see our chart-analysis guide and guide to using ChartGPT.
Trader checklist for your next research question
Before using NinjaTrader indicator data for another question:
- Record the instrument, contract if needed, interval, timezone, dates and whether each historical bar is complete.
- Check exposed plots, gaps in history and your export, keeping context notes with it.
- Check what you share; hiding columns does not guarantee privacy.
- Choose a model that fits, check costs and verify the answer.
To try this workflow on your desktop trading platform, explore ChartGPT or view the trial. It connects chart research with your chosen provider; you still need to check the result.