

How to use AI for NinjaTrader technical analysis
You can use AI for NinjaTrader technical analysis by sending a bounded set of chart evidence, asking one focused research question, and verifying the response against the current NinjaTrader 8 chart. The useful output is a reviewable set of observations and hypotheses—not a prediction or an instruction to place a trade.
The goal is to make NinjaTrader 8 research more structured without allowing a model to place or manage trades. Capture the right chart context, separate observable facts from interpretation, and check every important claim against current platform data.
A practical NinjaTrader AI market research workflow has seven stages:
- Define one research question.
- Select the relevant NinjaTrader 8 context.
- Capture structured chart data and, when useful, a chart screenshot.
- Write a constrained prompt.
- Review the model’s analysis for capability and missing context.
- Verify the findings in NinjaTrader 8.
- Record the result for later comparison.
This approach is designed for discretionary traders. AI supports research and organization; you remain responsible for interpretation, risk decisions, and execution.
For futures traders, the workflow keeps market conditions, volatility, and risk-management questions tied to evidence from the NinjaTrader 8 trading platform. It can organize historical data and current chart context, but it does not generate or execute a trading strategy.
Start with one decision-shaped research question
A broad request such as “Analyze the market” usually produces a broad response. It may mix trend description, possible scenarios, economic events, indicators, and trade ideas without making clear which evidence supports which conclusion.
Start with one question that can be answered using the data you provide.
Examples include:
- “Is price currently trading above or below VWAP, and what does that indicate about the session’s structure?”
- “What changed in volume behavior during the move from the overnight range into the regular session?”
- “Which visible support and resistance areas should I verify on this chart?”
- “Does the chart show a trend, a range, or insufficient evidence to classify the market?”
- “What information is missing before I can evaluate this setup?”
A useful question includes four elements:
| Element | Example |
|---|---|
| Instrument and session | NQ, regular trading hours |
| Time frame | 5-minute chart with a 30-minute context chart |
| Evidence | OHLCV, VWAP, volume profile, and screenshot |
| Output requested | Observations, interpretations, missing data, and verification steps |
Avoid combining unrelated requests. “Explain the trend, predict the next move, identify a trade, summarize news, and provide risk parameters” is too broad for a single prompt. Break it into separate research tasks.
The question should also specify what the model must not do. For example:
Do not provide an automated trading decision. Describe observable chart conditions, alternative interpretations, and what I should verify in NinjaTrader 8.
This keeps the workflow focused on analysis rather than unsupported certainty.
For additional guidance on framing chart questions, see the AI chart analysis guide.
Choose context for a NinjaTrader AI market research workflow
An AI system cannot reliably infer information that you do not provide. A chart screenshot may show candles and indicators, but it may not reveal the exact values behind them. Conversely, structured chart data can provide precise values without showing the visual arrangement of the market.
Select context based on the research question.
Chart context
Record the basics:
- Instrument or contract
- Trading session and time zone
- Chart type
- Time frame
- Date range
- Regular trading hours or extended hours
- Indicators and their settings
- Visible price scale
- Any manually marked levels
Structured Chart Data
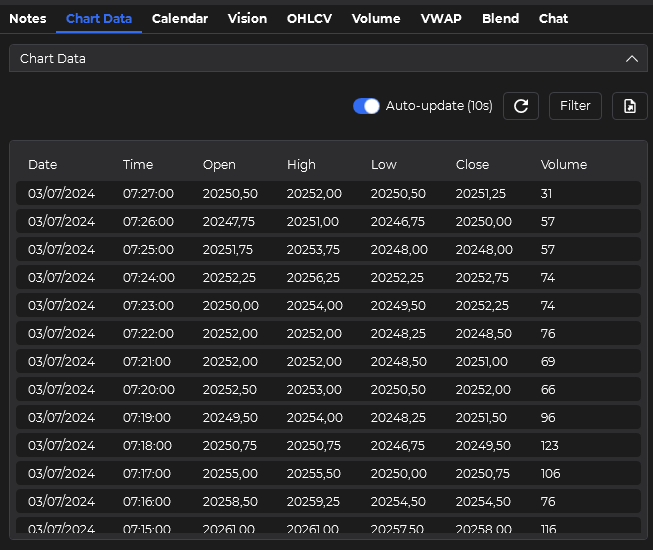
The Chart Data tab provides inspectable timestamps, OHLCV rows, and supported indicator columns.
When precision matters, provide structured information such as:
- Timestamp
- Open
- High
- Low
- Close
- Volume
- VWAP value
- Volume-profile levels, if available
- Session high and low
- Prior session high and low
- Opening range values
OHLCV data helps the model examine price and volume in a consistent format. It does not automatically provide every market feature. If you want analysis of VWAP or volume profile, include the relevant values or clearly state that the model should not infer them from incomplete information.
Curated market inputs
Some questions require information outside the chart. For example:
- Scheduled economic calendar events
- Session boundaries
- Contract specifications
- Exchange or platform details
Only include external context that is relevant to the question. If the timing or source of an economic event matters, record the event name, scheduled time, time zone, and source. Do not assume that a model knows the current calendar or the current market state unless you provide and verify it.
You can review current product behavior in the Trading Neural documentation.
Chart screenshot with drawings
A chart screenshot can help the model interpret visual relationships, such as:
- Whether price is compressing near a visible level
- The sequence of swings
- The location of gaps or prominent rejection areas
- The relationship between multiple plotted indicators
- Whether the chart appears balanced or directional
Before sending a screenshot, check that the labels, time scale, price scale, and indicator panels are readable. Crop out unrelated windows and avoid including account information, order details, or personal identifiers.
A screenshot is evidence, not a complete data source. It may omit historical bars, exact values, hidden settings, or the broader session context.
Check freshness, range, columns, and visible context before sending
The strongest workflow combines visual context with structured chart data when both are necessary. This is more useful than sending a screenshot with no explanation or pasting raw data without identifying the chart conditions.
Create a small research package for each question.
Suggested package structure
Research question
Is the regular session holding above VWAP after the opening range, or is the apparent strength weakening?
Chart metadata
- Instrument: [instrument]
- Session: [session]
- Time zone: [time zone]
- Chart time frame: [time frame]
- Data range: [start and end]
- Chart type: [type]
Available data
- OHLCV: [included/not included]
- VWAP: [included/not included]
- Volume profile: [included/not included]
- Economic calendar: [included/not included]
- Screenshot: [included/not included]
Known limitations
- The screenshot begins after the overnight session.
- Volume-profile settings are not included.
- The economic calendar has not been checked.
- The data is delayed or incomplete.
This format gives the provider and model a clear boundary around the evidence. It also makes later verification easier.
Do not describe an indicator as available when you have not supplied its value or made it visible in the screenshot. If the model cannot determine a value, require it to say so.
A useful instruction is:
Use only the supplied chart, data, and stated context. Mark any unsupported conclusion as uncertain. Do not infer exact indicator values from a low-resolution screenshot.
Choose a provider and a capability-matched model
There is no universal best provider or model for every workflow. Choose based on the input and the task.
| Requirement | What to check | Common limitation |
|---|---|---|
| Text analysis | Can it process your prompt and structured data? | May not interpret screenshots |
| Chart screenshot review | Does the model support image input? | May miss small labels or exact values |
| Current information | Does the workflow provide a current, verifiable source? | General model knowledge may be outdated |
| Long research log | Can it handle the amount of supplied context? | Important details may be overlooked |
| Repeated use | Are usage limits and pricing acceptable? | Cost can increase with large inputs |
Treat provider claims and model capabilities as things to verify before relying on them. Confirm whether image input, file handling, current information, and relevant integrations are actually available in the plan or interface you are using.
Cost also depends on how much context you send and how often you repeat the workflow. Large screenshots, long OHLCV files, and multiple follow-up prompts may consume more usage than a short, focused request. Start with the smallest input that can answer the question, then add context only when verification shows it is needed.
Privacy and data handling
Before sending chart material to an external provider, review what the image or data contains.
Remove or obscure:
- Account numbers
- Personal names
- Brokerage identifiers
- Order tickets
- Position size
- Balances
- API keys
- Private notes
- Any other information unrelated to the research question
A chart screenshot can reveal more than intended if the platform window includes account panels or order information. Crop the image and inspect it before uploading.
Review the provider’s current privacy and data-use terms. Do not assume that a provider treats chart uploads, prompts, and files in the same way as local NinjaTrader 8 data. If your organization has specific data-handling requirements, follow those requirements before using an external AI service.
Privacy protection does not require eliminating useful context. It requires sending only the context needed for the question.
Write a prompt that requests evidence, counter-evidence, and uncertainty
The following sequence turns an open-ended AI interaction into a repeatable process.
Stage 1: Define
Write one question and one intended output. Decide whether you need observations, scenario analysis, a list of missing information, or a verification plan.
Example:
Determine whether the chart provides enough evidence to classify the current session as directional or balanced.
Stage 2: Prepare
Collect the required NinjaTrader 8 context. Confirm the instrument, session, time frame, chart type, and indicator settings. Export or copy structured chart data when exact values matter.
Do not collect everything by default. Extra data can distract from the question and make it harder to identify which evidence affected the response.
Stage 3: Describe
Provide factual metadata before asking for interpretation. State what is visible and what is not available.
For example:
The screenshot shows a 5-minute regular-session chart with VWAP and volume bars. Exact volume-profile levels are not provided. The chart begins at the session open.
This prevents the model from treating missing context as negative evidence.
Stage 4: Prompt
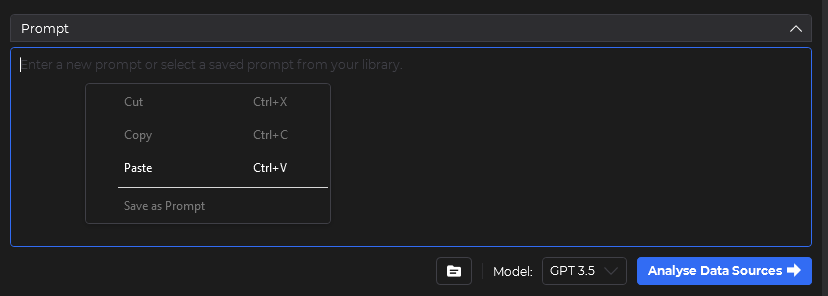
Use the documented prompt area to state the evidence, output structure, and limits you want the model to follow.
Give the model a defined role and output format. A useful prompt can require five sections:
- Observable facts
- Reasonable interpretations
- Alternative explanation
- Missing or unreliable information
- NinjaTrader verification steps
For example:
Review the supplied NinjaTrader 8 chart context. First list only observable facts. Then provide no more than two interpretations. For each interpretation, identify the evidence supporting it and one alternative explanation. Do not predict a guaranteed outcome or issue an automated trading instruction. End with specific values or chart areas I should verify in NinjaTrader 8.
Stage 5: Review
Read the response for unsupported assumptions. Check whether the provider and model can handle the input type. A text-only model may not be able to interpret an image. A vision-capable model may still fail to read a crowded or low-resolution screenshot. A model with broad reasoning ability may not have current market data.
Model capability is not the same as current information. A model may explain VWAP conceptually while being unable to confirm the current VWAP value. It may describe an economic calendar without knowing whether a release was revised or whether the schedule changed.
Separate observations from interpretations
One of the most important controls is to distinguish what the chart shows from what someone concludes about it.
Observation
Price traded above the supplied VWAP value for the final 12 bars in the sample.
Interpretation
The session may be showing short-term acceptance above VWAP.
The second statement is not automatically wrong, but it depends on context. The sample may be too short, the session may be near a major economic release, or the move may be occurring inside a larger range.
Ask the model to label these categories explicitly:
- Observed: directly visible or present in the supplied data
- Calculated: derived from supplied values
- Interpreted: an explanation of what the evidence may mean
- Unknown: not available from the provided context
- Requires verification: must be checked in NinjaTrader 8 or another current source
This labeling makes it easier to identify overconfident language. Words such as “confirms,” “guarantees,” or “will” require particular scrutiny in market research.
Verify the response against the chart and source data
Return to NinjaTrader 8 and check each material claim. Compare the response with the actual chart, indicator values, session settings, and available market context.
Verification questions include:
- Is the stated price level visible on the chart?
- Does the VWAP relationship match the platform?
- Are the described highs and lows from the correct session?
- Does the volume behavior support the claim?
- Were extended-hours bars included or excluded?
- Was the economic calendar checked against a current source?
- Did the model mistake a visual impression for a measured value?
Record the prompt, response, assumptions, and follow-up question
Save the question, input package, response, corrections, and final assessment. Record what was useful and what failed.
A simple research log can include:
- Date and session
- Instrument
- Research question
- Data supplied
- Provider and model
- Key observations
- Verification results
- Missing context
- Follow-up question
The log is not a performance claim. It is a way to improve consistency and identify recurring data or prompt problems.
A reusable NinjaTrader AI market research workflow checklist
Use this checklist before and after each research session.
Pre-send checklist
- I wrote one specific research question.
- I identified the instrument and contract context.
- I recorded the session and time zone.
- I recorded the chart time frame and chart type.
- I listed the indicators and settings.
- I included OHLCV values when exact analysis matters.
- I included VWAP values if VWAP is part of the question.
- I included volume-profile information if relevant.
- I stated whether extended hours are included.
- I checked whether an economic calendar event is relevant.
- I removed private or account-identifying information.
- I confirmed that the provider and model support the input type.
- I stated what the model must not infer.
In the prompt
- I requested observations before interpretations.
- I asked the model to identify missing information.
- I requested alternative explanations.
- I prohibited guaranteed predictions.
- I requested specific NinjaTrader 8 verification steps.
- I asked the model to use only supplied or clearly identified current sources.
Post-response checklist
- I separated observed facts from interpretations.
- I checked every important value against NinjaTrader 8.
- I verified the session and time-frame assumptions.
- I checked VWAP and volume-profile claims.
- I checked any economic calendar reference.
- I marked unsupported statements as unverified.
- I recorded corrections and missing context.
- I avoided treating the response as an automated trading instruction.
Where ChartGPT fits inside NinjaTrader 8
ChartGPT operates inside NinjaTrader 8 and prepares the context you select for a configured provider and model. Chart Data can expose OHLCV and supported indicator data with filtering and reusable column layouts. Vision uses the visible chart and can include visible drawing context when the selected model supports images. Blend combines the documented Volume Profile, VWAP, OHLCV, and Calendar inputs; it currently excludes Vision images and Chart Data. Review the current documentation because provider and model capabilities can change.
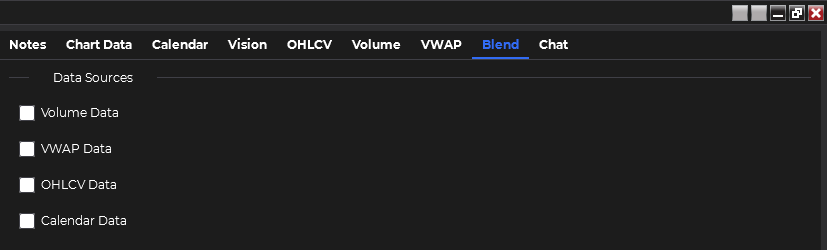
Blend lets you select several documented data sources for one research request without silently including every available input.
You do not need a complex system to begin. Select one instrument, one session, one chart time frame, and one research question. Supply a clear screenshot or structured chart data, ask for labeled observations and interpretations, and verify the result in NinjaTrader 8.
After several sessions, refine the NinjaTrader AI market research workflow by adding structured OHLCV data, VWAP, volume profile, or economic calendar context only where those inputs improve the answer. Keep the process discretionary and auditable: AI can organize evidence and suggest questions, but it cannot replace current platform verification or your own decision process.
If you want to test a chart-aware research workflow, review the ChartGPT overview and use the trial page to evaluate whether it fits your process.